Business impact:
- Prevent the death of breast cancer by early detection with machine learning;
- The lower overall cost for the treatment and diagnosis of breast cancer;
- Provide statistic analysis of feature importance to hospital for proper diagnosis
- TARGET:
- Predicting if the cancer diagnosis is benign or malignant based on several observations/features
- DATA
- Number of Instances: 569
- Class Distribution: 212 Malignant, 357 Benign
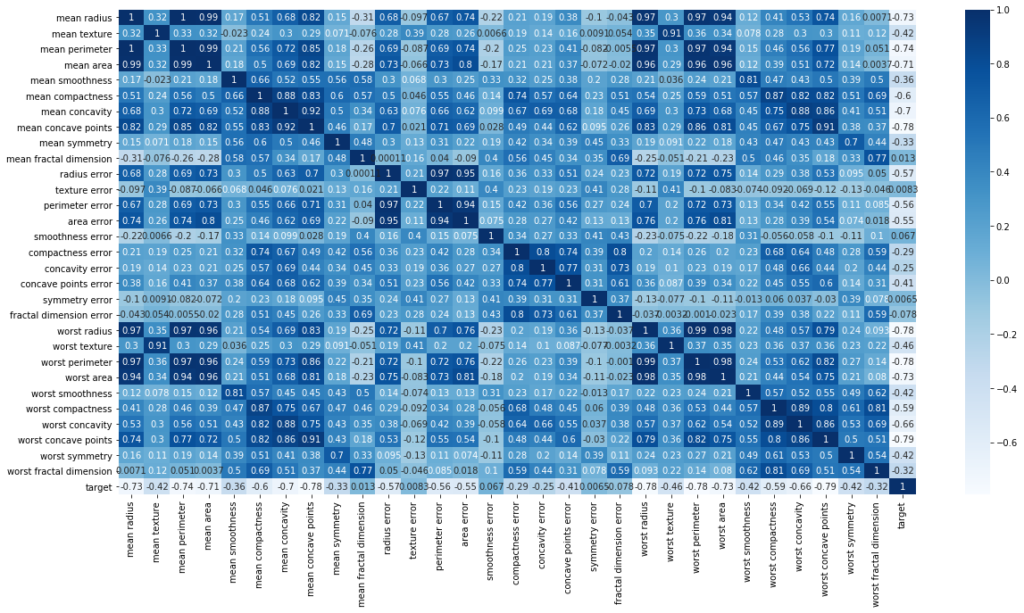
- 30 features are used, examples:
  - radius (mean of distances from center to points on the perimeter)
  - texture (standard deviation of gray-scale values)
  - perimeter
  - area
  - smoothness (local variation in radius lengths)
  - compactness (perimeter^2 / area - 1.0)
  - concavity (severity of concave portions of the contour)
  - concave points (number of concave portions of the contour)
  - symmetry
  - fractal dimension ("coastline approximation" - 1)
#Load dataset from the sklearn library
from sklearn.datasets import load_breast_cancer
After split dataset to train and test dataset, and perform several pre-processing steps, such as normalization, feature extraction, I implemented random forest classifier for binary classification
RFC = RandomForestClassifier(n_estimators= 100,max_depth= 100, min_samples_split= 5,n_jobs=-1)
RFC.fit(X_train, y_train)
Then we predict test dataset:
predictions=RFC.predict(X_test)
print(recall_score(y_test, predictions))
print(accuracy_score(y_test, predictions))
print(precision_score(y_test, predictions))
print(classification_report(y_test, predictions))

1.0
0.9736842105263158
0.9565217391304348
              precision    recall  f1-score   support

         0.0       1.00      0.94      0.97        48
         1.0       0.96      1.00      0.98        66

    accuracy                           0.97       114
   macro avg       0.98      0.97      0.97       114
weighted avg       0.97      0.97      0.97       114
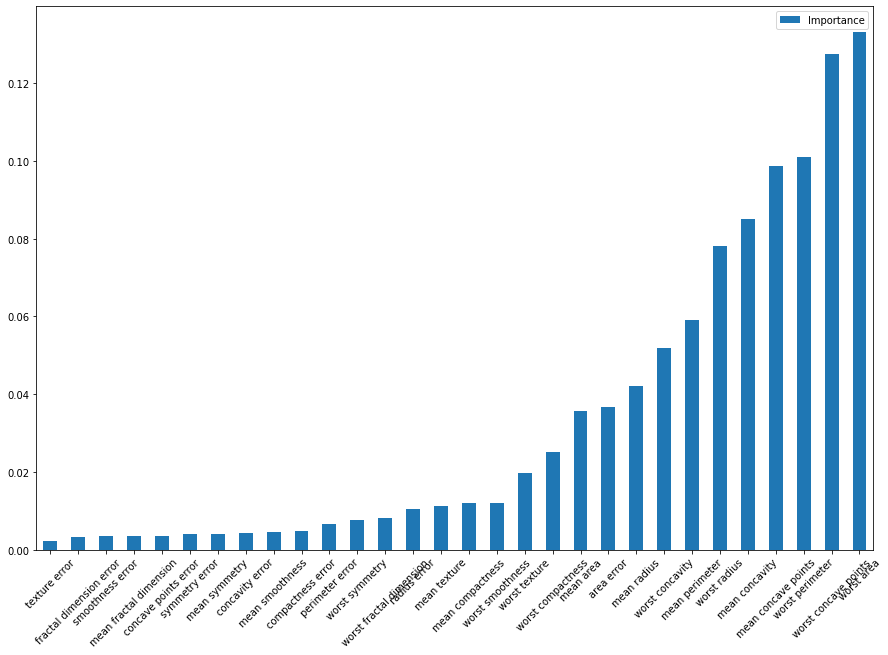
After analyzing each feature’s importance, we can plot the feature importance towards the ability to detect breast cancer:


