Business impact:
- Many companies have a mobile presence to provide free/trial service in an attempt to transfer their customers to a paid membership , such as Netflix, Youtube Red, Microsoft 365, Adobe cloud service and so on;
- Companies need to know which customer will most likely to pay for service and to target with offers and promotions;
- However, in many cases, customer data is rarely clean and requires additional preprocessing steps to make data available to build a solid machine learning model.
- Data source: Fintech case study from Udemy
Pro-processing steps:
dataset = pd.read_csv('appdata10.csv')
dataset.head(5) # Viewing the Data| user | first_open | dayofweek | hour | age | screen_list | numscreens | minigame | used_premium_feature | enrolled | enrolled_date | liked | |
| 0 | 235136 | 2012-12-27 02:14:51.273 | 3 | 02:00:00 | 23 | idscreen,joinscreen,Cycle,product_review,ScanP… | 15 | 0 | 0 | 0 | NaN | 0 |
| 1 | 333588 | 2012-12-02 01:16:00.905 | 6 | 01:00:00 | 24 | joinscreen,product_review,product_review2,Scan… | 13 | 0 | 0 | 0 | NaN | 0 |
| 2 | 254414 | 2013-03-19 19:19:09.157 | 1 | 19:00:00 | 23 | Splash,Cycle,Loan | 3 | 0 | 1 | 0 | NaN | 1 |
| 3 | 234192 | 2013-07-05 16:08:46.354 | 4 | 16:00:00 | 28 | product_review,Home,product_review,Loan3,Finan… | 40 | 0 | 0 | 1 | 2013-07-05 16:11:49.513 | 0 |
| 4 | 51549 | 2013-02-26 18:50:48.661 | 1 | 18:00:00 | 31 | idscreen,joinscreen,Cycle,Credit3Container,Sca… | 32 | 0 | 0 | 1 | 2013-02-26 18:56:37.841 | 1 |
| 5 | 56480 | 2013-04-03 09:58:15.752 | 2 | 09:00:00 | 20 | idscreen,Cycle,Home,ScanPreview,VerifyPhone,Ve… | 14 | 0 | 0 | 1 | 2013-04-03 09:59:03.291 | 0 |
The customer data is kind of a mess, and there is much information that may not be useful or not understandable even for human-being. It will bring difficulty for machine to train a model. We need to perform feature engineering and cleaning to the raw data.
Simple cross-correlation analysis between different features:
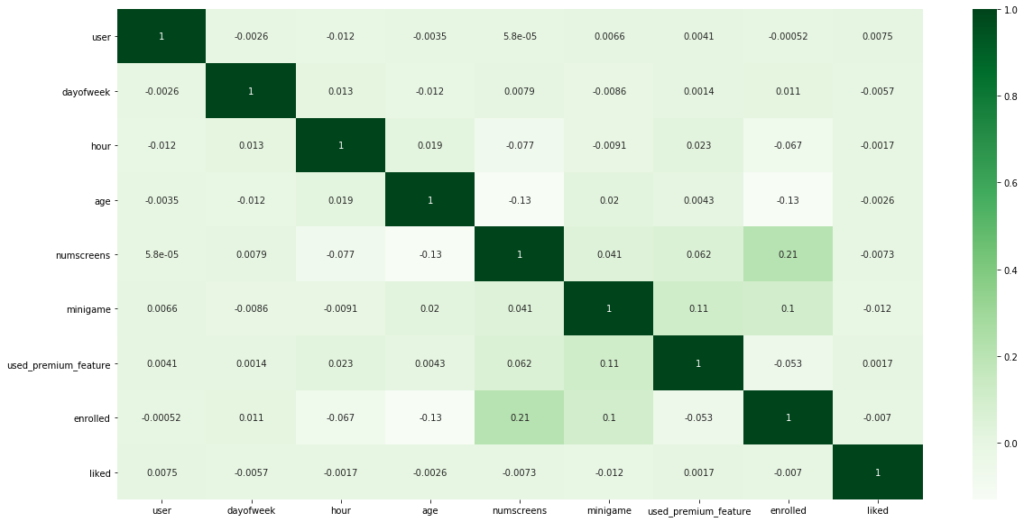
Some feature engineering steps are considered:
- Convert data type from string to int for integer number;
- Drop out some columns which may contain too many “N/A”, which could bring instability in training;
- Calculate cross-correlation between different features and response rate to analyze the data;
- Correlation matrix and heatmap are two very useful figures to plot the relationship between different features;
- Normalization and standardization
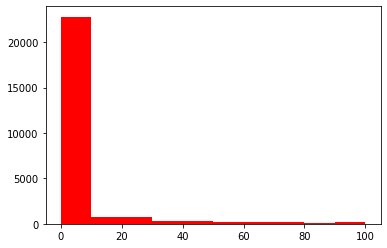
Such as, calculate how long will users subscribe to the service after they start to use the app:
 from dateutil import parser
dataset['first_open'] = [parser.parse(row_date) for row_date in dataset['first_open']]
dataset['enrolled_date'] = [parser.parse(row_date) if isinstance(row_date, str) else row_date for row_date in dataset['enrolled_date']]
#New feature
dataset['difference'] = (dataset.enrolled_date - dataset.first_open).astype('timedelta64[h]')
plt.hist(dataset['difference'].dropna(), color='r', range=[0,100])
Model building
After pre-processing, we can start to build model:
from sklearn.model_selection import train_test_split
X_train, X_test, y_train, y_test = train_test_split(dataset, target, test_size = 0.2, random_state =0)
Implementscaling to training and testing data:
from sklearn.preprocessing import StandardScaler
sc_X = StandardScaler()
X_train = pd.DataFrame(sc_X.fit_transform(X_train))
X_test = pd.DataFrame(sc_X.transform(X_test))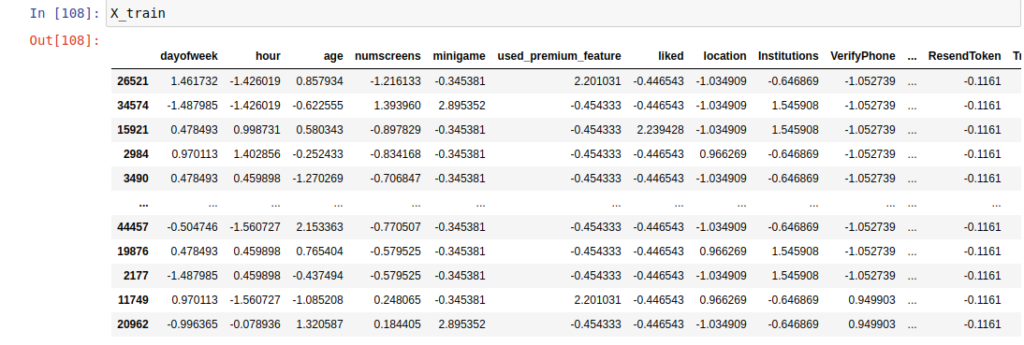
from sklearn.linear_model import LogisticRegression
from sklearn.metrics import confusion_matrix, accuracy_score, f1_score, precision_score, recall_score

#Training
classifier = LogisticRegression(random_state = 0, penalty = 'l1')
classifier.fit(X_train, y_train)
#Prediction
y_pred = classifier.predict(X_test)
#Evaluation
cm = confusion_matrix(y_test, y_pred)
accuracy_score(y_test, y_pred)
precision_score(y_test, y_pred) # tp / (tp + fp)
recall_score(y_test, y_pred) # tp / (tp + fn)
f1_score(y_test, y_pred)
accuracy_score(y_test, y_pred)= 0.7681
precision_score(y_test, y_pred)= 0.7618952017667135
recall_score(y_test, y_pred)= 0.7700892857142857
f1_score(y_test, y_pred)= 0.7659703300030276
The last step, I implemented random forest classifier to analyze the importance of each feature, it gives a rough estimation of which feature could contribute more weights on the prediction result:
import pandas as pd
%matplotlib inline
feats = {} # a dict to hold feature_name: feature_importance
for feature, importance in zip(X_train.columns, RFC.feature_importances_):
    feats[feature] = importance #add the name/value pair

importances = pd.DataFrame.from_dict(feats, orient='index').rename(columns={0: 'Importance'})
importances.sort_values(by='Importance',ascending=False).plot(figsize=(20,10), kind='bar', rot=45)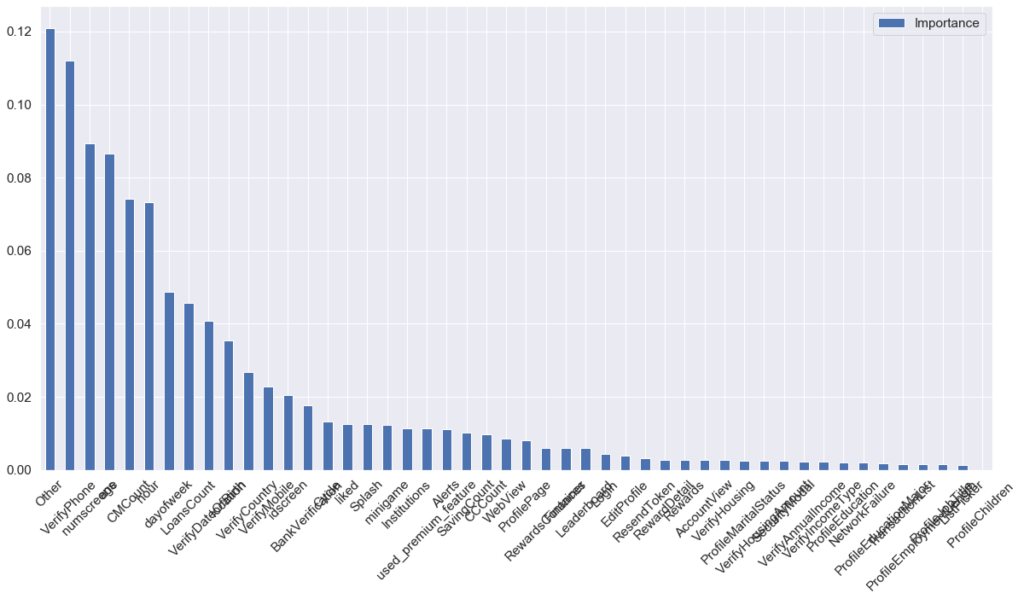
Conclusions
- Analyze collected app usage data to help the company build a model to estimate what kind of customer will most like to subscribe and pay for service;
- Help marketing and ads group to provide offers and promotion to a specific target and increase subscription rate;
- For those users who may not subscribe predicted by the model, we could offer them greater discount and it will still bring revenue to the company if they decide to accept the offer and subscribe in the end.